
| LarryFrolich.com |
 |
 Evolution of Novelty
Wish List
The BIG question--how do genetic/population level processes bring about phenotypic/morphological species-and-above innovations?
Or how does "micro-evolution" link to "macro-evolution?"
From Point Mutations to Evolutionary Innovations
Small quantitative or point changes lead to qualitative/phenotypic change?
HIstorically, generation of metabolic/point-level mutations early and then stabilized metabolisms for rest of life's history?
Changes in developmental control genes like Hox
Changes in developmental timing--heterochrony--might be under relatively simple genetic control
Major morphological change--most is still hard to contribute to genetic/population events
Examples--vertebrate body plan, tetrapod limbs
But genetic sequence trees do reflect phenotypic/morphological change
example--10,000 vertebrates
From Point Mutations to Major Evolutionary Change--is it possible?
Gradual build-up of small quantitative changes can lead to qualitative change
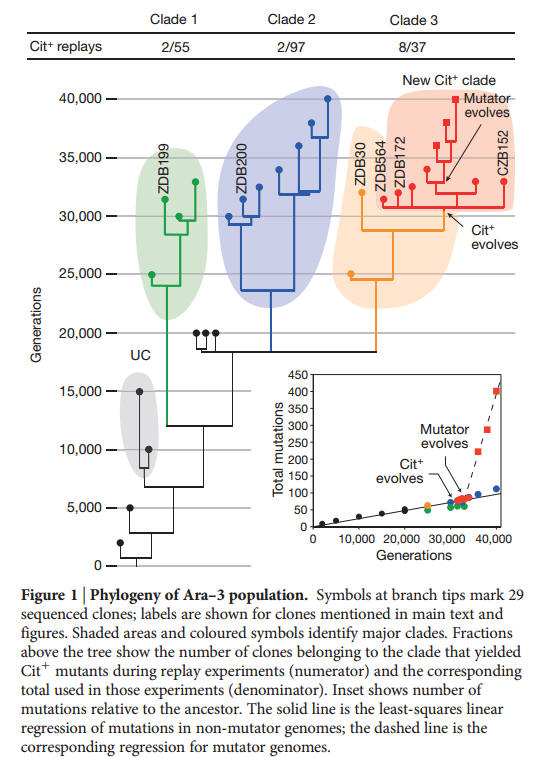
From Lenski lab long-term E. coli experiment--biggest innovation is Cit+ (aerobic citrate utilization) (PDF)

Figure 1 | Rates of macroevolutionary events over time.
Average rates of gene From David and Alm in Nature (PDF)birth (red), duplication (blue),HGT (green), and loss (yellow) per lineage (events
per 10Myr per lineage) are shown. Events that increase gene count are plotted to
the right, and gene loss events are shown to the left. Genes already present at the
Last Universal Common Ancestor are not included in the analysis of birth rates
because the time over which those genes formed is not known. The Archaean
Expansion (AE) was also detected when 30 alternative chronograms were
considered (Supplementary Fig. 9). The inset shows metabolites or classes of
metabolites ordered according to the number of gene families that use them that
were born during the Archaean Expansion compared with the number born
before the expansion, plotted on a log2 scale.Metabolites whose enrichments are
statistically significant at a false discovery rate of less than 10% or less than 5%
(Fisher’sExactTest) are identified with one or twoasterisks, respectively.Bars are
coloured by functional annotation or compound type (functional annotations
were assigned manually). Metabolites were obtained from the KEGG database
release 51.0 (ref. 27) and associated with clusters of orthologous groups of
proteins (COGs) using the MicrobesOnline September 2008 database28.
Metabolites associated with fewer than 20 COGs or sharing more than twothirds
of gene families with other included metabolites are omitted.
Abbreviations are defined in Supplementary Table 3.
Evolution of development control genes like Hox
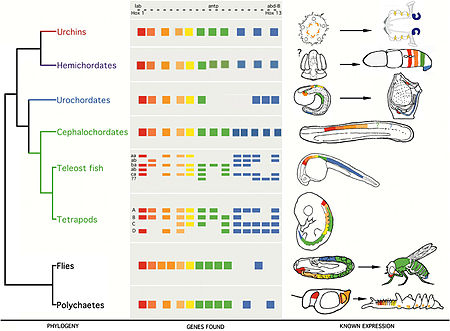

Starting to get at protein conformational change basis for Hox genetic changes, from Hueber et al.
Here's simple overview of findings
Morphological innovations in multi-celled organisms are on a different scale
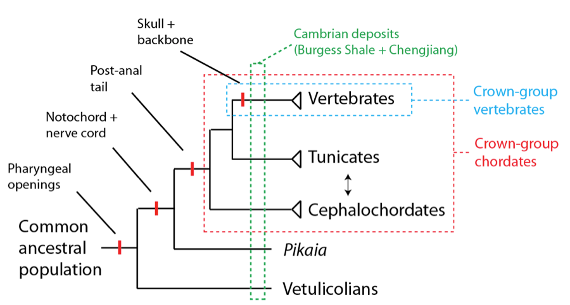
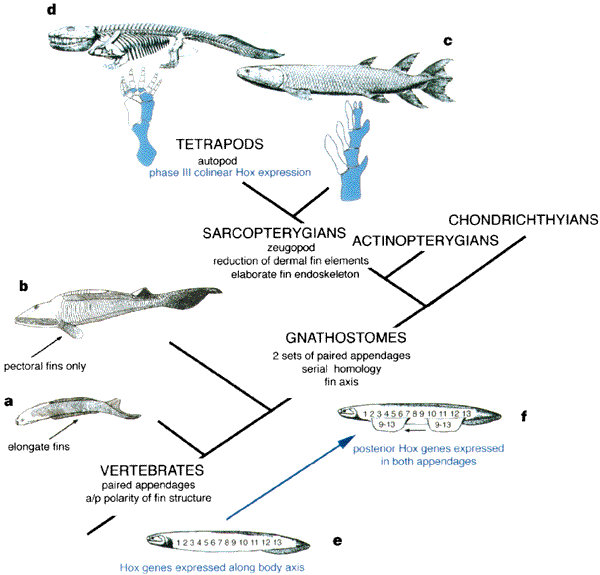
Major morphological innovations at base of vertebrates
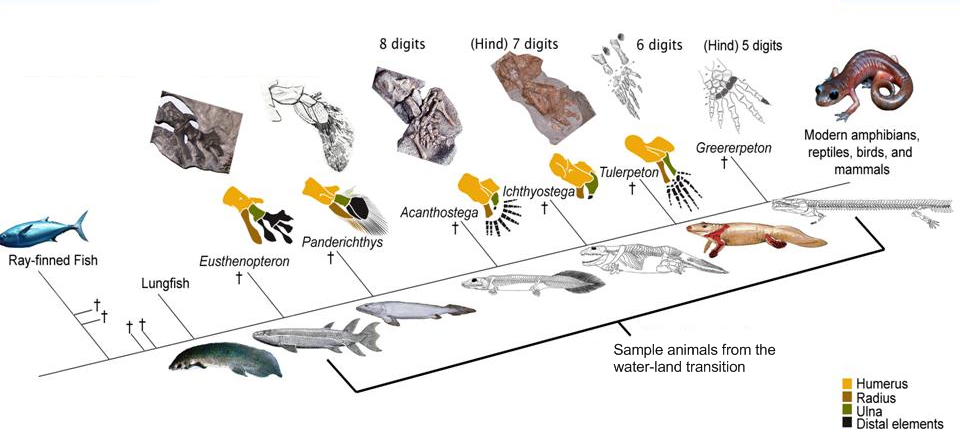
Gradual changes leading to innovation of limbs.
Ontogenetic shifts or heterochrony lead to evolutionary innovation

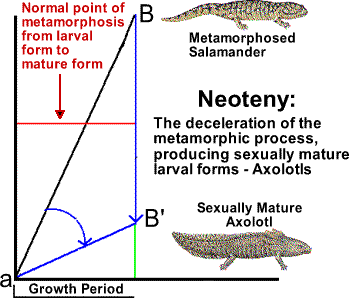
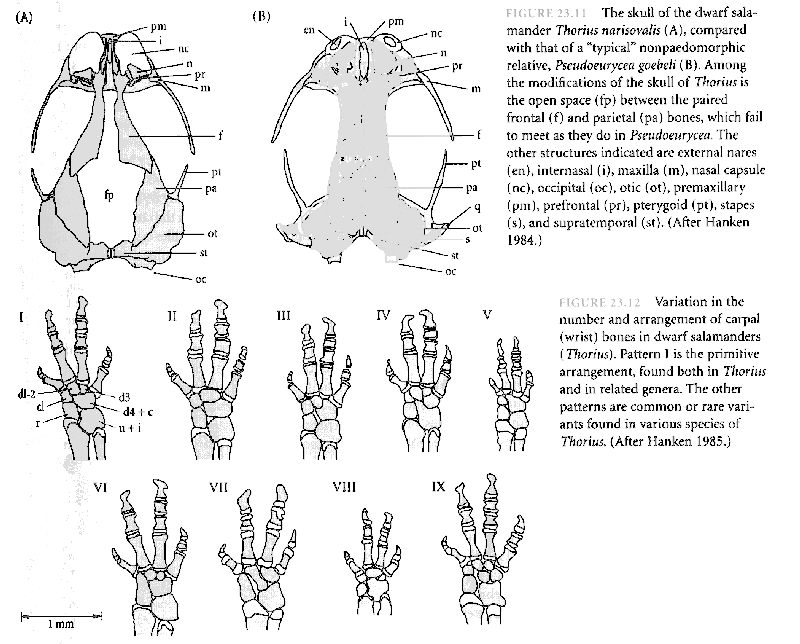
Overview of heterochronic processes
Crucial to have good phylogenetic trees based on morphology and DNA to identify key innovations
Inaugural Publication--highly cited
Web Resources
Larry M Frolich, Ph.D.
∞
Miami Dade College
∞
Wolfson
Campus
∞
Natural Sciences
∞
Miami, FL
33132
∞
Office 1504
∞
(305) 237-7589
∞
e-mail
![]()